

Background
In the framework of wind farm development, financing and operation, developers regularly need to quantify on a reliable way the wind turbulence intensity located on the sites. This information can be used to validate wind farm layouts and select the appropriate turbines to be installed during the development process and to optimise the wind farm operation. The current instrumentation to measure the turbulence intensity is anemometer (cup- or sonic-) mounted on a meteorological mast, with a measurement altitude as close as possible to the hub height. Though, cost and technical constraints specific to offshore configurations make this solution not affordable and is replaced by remote sensing (LiDAR) instrumentation mounted on buoys (floating LiDAR Systems). This alternative is now accepted during wind project developments and the quality of the obtained 10-min averaged wind statistics had been validated. That is not the case for turbulence intensity.
The 24-month MATILDA project aims at quantifying the error on the turbulence intensity measurement due to motions of the floating LiDAR and at proposing corrections depending on the sea state. The analysis will be based on the comparison of measurements performed simultaneously by a fixed LiDAR system located on Fécamp offshore platform (owner EDF Renewables) and by a floating LiDAR system WINDSEA during its validation campaign (owner AKROCEAN). The Fécamp platform is also equipped with a met-mast (owner Eoliennes Offshore des Hautes Falaises, consortium composed of EDF Renewables, Enbridge and WPD Offshore). As preliminary testing, turbulence intensity measurement comparison between conventional instrumentation (cup and sonic anemometers) and a fixed LiDAR profiler will be performed within MATILDA thanks to a measurement campaign that will be carried out on a VALOREM operated site.
Additionally, a displacement system able to impose to a LiDAR system controlled motions similar to full scale floating motions will be designed.
Scientific advances and innovation
- Processing of statistical wind data obtained in non-controlled environments (wind + wave)
- Correction laws and processing algorithms to more reliably assess the turbulence intensity with a floating LiDAR
- Design of a full scale displacement system to reproduce floater motions (buoys or wind turbine floaters)
Expected technical and economic impact
Floating LiDAR is an accepted metrology for wind resource assessment of offshore wind energy projects under development and operation. It is also deployed on future floating wind farm projects, where no other instrumentation can be installed due to too important sea water depth. 10-min averaged wind speed and direction are the standard values extracted from the floating LiDAR measurements and are considered as reliable. This information is generally enough to assess the annual yield production, but prevents from assessing the wind turbine lifetime. Indeed, the structural fatigue is directly related to the wind speed fluctuations, primarily characterized by the turbulence intensity. The measurement error of the turbulence intensity obtained by floating LiDAR system and its dependency to the sea states (wave periods and specific heights, wind/wave direction, etc.) are not yet quantified, and the limit met-ocean conditions, beyond which measurement correction and/or motion compensation are needed, are not yet known.
MATILDA project aims at contributing to the collective effort from the scientific community working on offshore wind resource assessment by assessing and reducing the measurement error of turbulence intensity by floating LiDAR system through full scale data post-processing and analysis, and the design of a full scale test bench able to reproduce controlled floating LiDAR motions.
Key project milestones
- Oct. 2019 - Project Kick-off
- Jan. 2020 - Post-doc recruitment
- Jan.-Mar. 2020 - Creation and exploitation of a measurement database to compare wind data from a meteorological mast and a fixed LiDAR profiler
- Jan.-Oct. 2020 - Exploitation of a measurement database to compare wind data from a meteorological mast and a floating LiDAR profiler
- Dec. 2020 - Correction laws for turbulence intensity measurements with fixed and floating LiDAR profilers
- Dec. 2020 - Specifications of a full scale displacement system to reproduce floater motions
- Dec. 2021 - Publications of results in high ranking scientific journals
Results
1/ Technological and bibliographical study
Profiler lidars measure vertically an entire atmospheric boundary layer profile. The number of laser positions used depends on the lidar model. In this study, we focus on the WindCube V2 lidar which has five positions: one vertical and four at the angles Φ=28° and θ=(0°,90°,180°,270°) according to the notations in Figure 1.
![Figure 1: Positions of the lidar profiler lasers [1].](http://www.weamec.fr/en/wp-content/uploads/sites/2/2019/10/Figure-1-Positions-des-lasers-de-lidar-profiler-1-300x277.png)
Figure 1: Positions of the lidar profiler lasers [1]
D=2h tanΦ
Thus, the diameter of the measuring circle is 245m at an altitude of 200m. The distance between the measurement vectors implies two measurement errors: an average error and an error called cross-contamination. The cross-contamination error is due to the equations of the VAD method which are based on a first-order Fourier decomposition of radial velocities. Higher order terms are associated with divergence and deformation [3].
The estimation error of profiler lidars is small compared to sonic anemometers for the measurement of mean wind at 10min [2]. However, it is important for the measurement of turbulence intensity for two main reasons: the filtering of small turbulence scales due to the large measurement volume and the contamination by the correlation of the phenomena between the two measurement points [4]. Post-processing methods to limit the measurement error of turbulence intensity are proposed in the literature, two of which have attracted our attention: Squeezing [1] and Six-Beams [4].
The sea motion induced by the buoy implies a sway of the lidar and an additional uncertainty on the position of the measurement points. The influence of the different platform motions on the measurement of a lidar can be estimated theoretically [5]. However, an experimental study over a time period representative of annual conditions would allow to evaluate precisely the magnitude of the error of measurement of turbulence intensity according to the different movements of the buoy.
The methods allowing the correction of the buoy motion on the lidar measurement are known [6], they have been implemented for Zephir type lidar measurements [7] but no algorithm has been explained in the literature for a floating WindCube V2.
[1] F. Kelberlau and J. Mann, Better turbulence spectra from velocity-azimuth display scanning wind lidar, Atmos. Meas. Tech. 12, 1871-1888, 2019
[2] Sathe, A., Banta, R., Pauscher, L., Vogstad, K., Schlipf, D., & Wylie, S. (2015). Estimating Turbulence Statistics and Parameters from Ground- and Nacelle-Based Lidar Measurements: IEA Wind Expert Report. DTU Wind Energy.
[3] Browning, K. A. and Wexler, R.: The determination of kinematic properties of a wind field using Doppler radar, J. Appl. Meteorol, 7, 105-113, 1968.
[4] A. Sathe, J. Mann et al. A six-beam method to measure turbulence statistics using ground-based wind lidars, Atmos. Meas. Tech. 8, 729-740, 2015
[5] J. Gottschall, B. Gribben Floating lidar as an advanced offshore wind speed measurement technique: current technology status and gap analysis in regard to full maturity, WIREs Energy Environ Volume 6, September/October 2017
[6]J. B. EDSON, Direct Covariance Flux Estimates from Mobile Platforms at Sea, JOURNAL OF ATMOSPHERIC AND OCEANIC TECHNOLOGY, Volume 15, April 1998
[7] F. Kelberlau Taking the Motion out of Floating Lidar: Turbulence Intensity Estimates with a Continuous-Wave Wind Lidar Remote Sens. 2020, 12, 898
2/ First exploitations of the measurements at the Fécamp site
On the offshore site of Fécamp (N:5525385.76, E:300078.33), a database containing the measurements of a floating lidar (WindCube v2 – data at 1s), fixed (WindCube – data at 10min) and cup anemometers on measuring mast (altitude 58.4m – data at 10min) has been gathered thanks to the industrial partners AKROCEAN and EDF Renouvelables. A first study of the measurements was carried out, it is considered here that the mast has a negligible effect on the measurement of the two lidars.
SELECTION OF 13 WEEKS OF REPRESENTATIVE DATA
Using meteoceanic data provided by AKROCEAN and the ERA5 database, 13 weeks of data were selected in the period from 21/04 to 31/10/2018. The selection criteria were to maximize data availability and to represent the full range of ocean weather conditions for the 6 months. To classify the data, the most representative variables (wave height, period and direction; wind speed, direction and shear; precipitation and temperature) were selected and a clustering method was implemented. The clustering method identified seven groups of data following globally the same trends for the 8 variables.
Subsequently, 13 weeks were selected to represent all the clusters of meteorological and oceanic conditions and to capture the most unstable periods.
VALIDATION OF FIXED AND FLOATING LIDAR MEASUREMENTS
The measurement altitude of the cup anemometers being low, they are used to validate the coherence of the measurements of the two lidars (fixed and floating). Here, the measurements of the lidars are taken from the 10min files processed by the algorithm implemented by LEOSPHERE. It can be seen in Figure 2 that the measurements of the two lidars are consistent with those of the anemometer in terms of mean wind speed. The study of the turbulence intensity reveals an overall overestimation of the floating lidar compared to the fixed lidar.
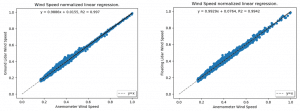
Figure 2: Linear regression of normalized horizontal wind speed of fixed (left) and floating (right) lidars compared to the anemometer measurements at 58.4m altitude.
EVALUATION OF POST-PROCESSING METHODS FOR THE SECOND MEASUREMENTS
Algorithmic sea motion corrections on the floating lidar measurements will be applied to the data to the second, it is therefore essential to implement post-processing for the calculation of the quantities at 10min. Thus, several peak filtering methods (Std or Wang) and data sampling methods (1B and 5B) have been applied.
To evaluate these post-processing methods, the relative absolute error with respect to the measurement of the turbulent intensity of the fixed lidar is compared to that implemented by LEOSPHERE (Process_LEO) in Figure 3.
Thus, it can be observed that the treatments applied to the measurements per second and the method of calculation of the turbulence intensity (linear detrend and alignment to the mean wind direction) reduce the error of the floating lidar compared to the internal treatment of the lidar.
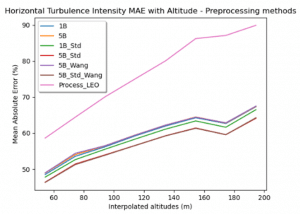
Figure 3: Relative absolute error of the floating lidar turbulence intensity estimate compared to the fixed lidar measurement – comparison of several preprocessing methods
INFLUENCE OF METEOCEANIC CONDITIONS ON THE MEASUREMENT ERROR OF THE FLOATING LIDAR
The study of the measurements of the two lidars (fixed and floating) at different altitudes associated with the meteoceanic data from ERA5 and the AKROCEAN buoy allows a first evaluation of the influence of meteoceanic conditions on the measurement error of the floating lidar. The correlations between the meteoceanic variables and the measurement error of floating lidar compared to fixed lidar are presented in Table 1.
Atmospheric data are estimated by ERA5 with 1h data and wave data are estimated by the AKROCEAN buoy with 30min data. Thus, the measurement error of turbulent intensity at 10min induced by sea motion is averaged to match the temporality of the meteocean data sources.
This table should be read as follows: the higher the wave height is on average in the half hour, the greater the error in the measurement of turbulent intensity of the floating lidar, this trend increases with the increase in measurement altitude.
| Positive correlation | Negative correlation | Accentuation with altitude |
| Wave height, temperature at 2m, atmospheric stability | Rain, turbulent intensity, wave period, difference in direction between waves and wind | Wave height, difference in direction between waves and wind |
Table 1: Linear correlation between representative meteocean variables (estimated at 30min or 1h) and the absolute error of the floating lidar turbulence measurement compared to the fixed lidar
3/ Modeling the behavior of floating lidar
Floating lidar measurements are evaluated in comparison with fixed instrumentation whose error is considered lower than that of floating instrumentation due to the strong influence of waves. However, experimental measurements of fixed lidar and anemometers are polluted by uncontrolled errors due to the technology used and the meteorological oceanic conditions.
Thus, the implementation of a model makes it possible to get rid of this error and to compare the measurements of a simulated floating lidar to an absolute truth in the numerical simulation of wind conditions.
In this study, the TurbSim software is used to simulate turbulent wind slices which are then stacked to form a turbulence box. In this turbulence box, a lidar is simulated without the optical part (Figure 4).
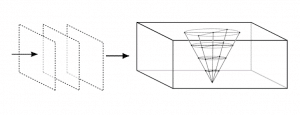
Figure 4: Schematic diagram of the floating lidar model
TurbSim’s turbulent wind modeling is based on a stochastic representation of turbulence, so it does not take into account all the physics involved. Thus, the use of this modeling to evaluate fixed lidar measurement correction methods is limited by the turbulence box.
However, the magnitude of the motion of a floating lidar due to the sea is known from experimental measurements and the model can be used to evaluate sea motion corrections. Thus, the measurements of the motion-corrected floating lidar can be compared to that of a fixed lidar modeled by the same method. The use of the model therefore allows the effect of wave motion on the theoretical measurement of the floating lidar to be isolated.
The implemented model presents measurement error estimates on the mean wind speed comparable to the experimental values (1~2%). The sea motion compensation algorithm has not yet been implemented.
Publications and papers published
Oral communications:
- Thibault Désert, Sandrine Aubrun, Graham Knapp, Maxime Bellorge, Benoit Clauzet, Romain Barbot. Measurement of the turbulence intensity with a Floating LiDAR System. FOWT 2021, 16-18 novembre 2021
- Thibault Désert, Sandrine Aubrun, Graham Knapp, Samy Kraiem, Maxime Bellorge, Benoit Clauzet, Romain Barbot, Lise Mourre. Error quantification as a function of metocean conditions and correction of wave induced turbulence intensity bias assessed with a Floating LiDAR System. WESC 2021, 25-28 mai 2021
Publications:
- T. Désert, G. Knapp and S. Aubrun, Quantification and Correction of Wave-Induced Turbulence Intensity Bias for a Floating LIDAR System, Remote Sensing, July 2021